Football players and coaches watch game film, looking for patterns in play calling and ways to exploit a team’s weaknesses.
Sounds perfect for a mathematician who focuses on statistics and probability, searching for the one key variable that impacts an outcome when studying several data points across a scatter plot.
This isn’t moneyball, where statistics and analytics make offensive and defensive decisions so a team of role players can become champions.
This is more machine learning where co-variants can help predict outcomes.
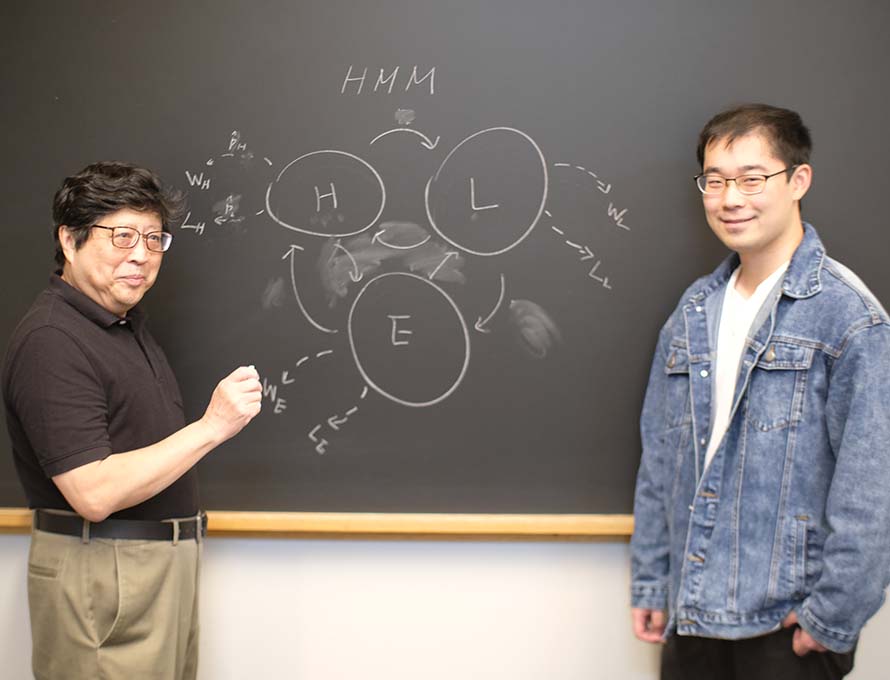
“If math provides the logic and a computer provides the speed, the human depth comes from how our neurons make multi-layered connections,” says Wei-Min Huang, professor of mathematics.
 After teaching and researching at Lehigh since 1982, he knows how rich the data set is around the Rivalry. He’s been witness to over 40 games, seven presidents, two stadiums, a handful of coaches, and hundreds of players. The sweetest of victories and bitter defeats.
“I love Lehigh and its students,” he says.
So he and graduate student Tian Qin ’25 looked at data from the last 139 years: score, winner, weather, temperature, wind, location, and total yardage. Then they ran a computation.
Their algorithm looked at the sequence of events — the clusters of wins, the away losses, and how long winning streaks lasted.
Would there be some kind of pattern to this model?
The answer is yes.
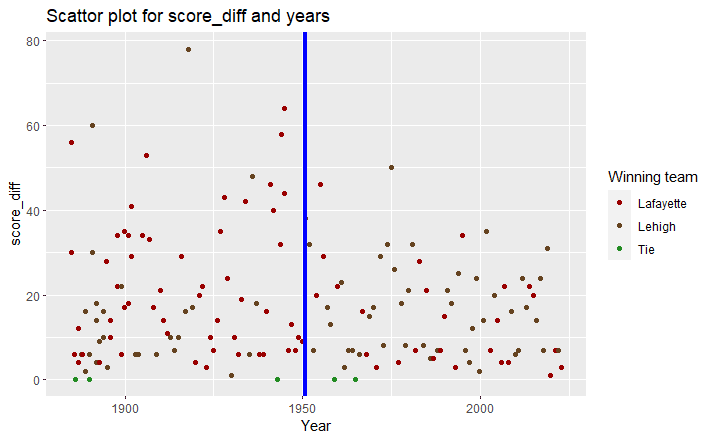
The last 50 years have been better to Lehigh. The scores are lower. The margin of victory is narrower. The consistent wins for Lehigh.
The end result: Lehigh has a 62% chance to win in 2023.
To arrive at that number, they used a hidden Markov model (HMM), which predicts the probability of a sequence of events based on the most recent events. Think of it in the way your text message app or search engine tries to predict the next word in your sentence based on the words before it.
In this model, each game is a state, and each state can result in either a win, loss, or tie. The math duo used only 151 games for fitting sequences of HMM, ruling out games that ended in a tie or that were held in other locations, like Wilkes-Barre and New York City.
Weather and temp were used in the preliminary analysis, but Huang and Qin found that those two covariates didn’t contribute significantly, and many of those data points were incomplete — it’s hard to find what the weather was like back in 1890. So those data points were not included in the final analysis.
One data point did create an impact: location.
The 62% derived from the initial HMM analysis doesn’t include the factor of location. If location is included, that percentage improves greatly — as seen in the second graph. (Statistically speaking though, with fewer games used in the analysis, the standard error of the estimate can also be higher.)
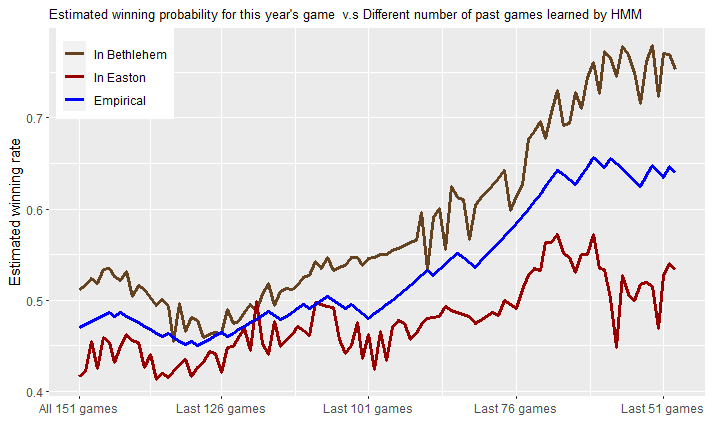
So, home field advantage brings an even greater chance of success for Lehigh.
But running counter to what the math predicts are the factors outside anyone’s control, things like heart, preparation, and hard work. While both teams will display those traits, how they are applied often creates momentum that can make any result feel like destiny.